Optimal reordering points and safety stocks for a smarter inventory management
Written by Vincent Béchard on 2020-01-14
The need for inventory management optimization
I am a simulation expert. To my eyes, a process is an oriented network of steps. In between steps, there are buffer zones. These buffers absorb variability and imperfect timing issues. Without buffering, no process would work efficiently and smoothly. What about inventory? It’s just larger, longer term, dedicated buffering.
Recently I had several non-simulation mandates where process understanding was critical but no model was built. The objectives were to set the proper min-max level thresholds for inventory management. While working on these problems, I realized that we consider inventories as a design parameter to be determined, not as a resulting buffer between process steps. Therefore, we focus on managing the inventory process instead of the processes causing the need for inventory!
Real-life challenges in inventory management
The traditional way to establish inventory thresholds consists of looking at recent data from consumption rates (or: demand, forecasts) and order lead times. There exist several formulas to calculate the adequate min-max, safety stocks, reorder points, etc. This technique is simple and great if:
- Mean and variance of lead time and demand are constant over time (time-stable distribution)
- The distribution is approximately Normal (symmetry, because tolerance intervals are involved in formulas)
- The lead times as well as demands are independent (lead times or demands would not be independent if we often find multiple successive low values and multiple successive high values for example)
Hence, we assume min-max thresholds are constant time-invariant values. What if the average demand changes over time (seasons, cycles, shifts), what if lead times are not symmetrically distributed? Plots on Figure 1 illustrate typical data.
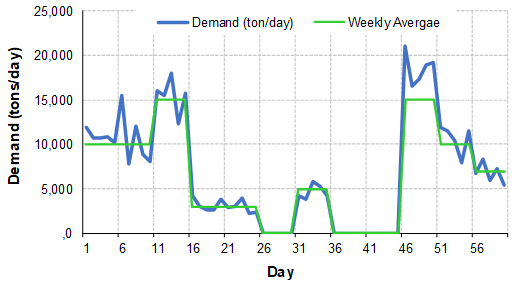
Figure 1a: Demand curves and forecasts
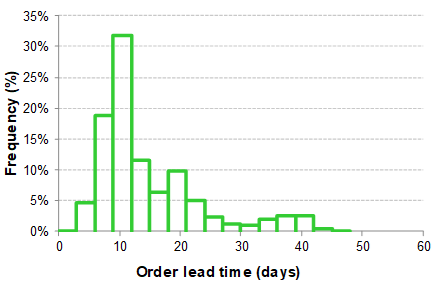
Figure 1b: Variability in lead times
Using constant min-max levels will not reflect the reality of alternating intense versus null demand! Therefore, the inventory will be: “too low” some weeks, “too high” the other weeks… Have you noticed? The discussion is around demand and lead time while the inventory is a consequence of the variability in those two factors...
Simulation-based reordering to minimize safety stocks
Why did we invent the min-max concept? To have a simple rule to minimize inventory levels as much as possible without running out-of-stock, and to limit overstock by suggesting when to stop ordering. Let’s rephrase mathematically: the goal is to minimize inventory levels (no sleeping money) under the constraint of never being empty. Our technique is based on this core time-based balance equation:
where It is the inventory level at the end of period t, R is the total amount received during period t and D is the total demand (or consumption) during period t. Here is the outline of the optimal ordering algorithm:
- Obtain forecasted demand for the next periods (finite time horizon), initial inventory level and expected reception dates and amounts of open orders
- Calculate the cumulative forecasted demand and reception (total since initiation to time t)
- Find the first period where cumulative reception is still above but touching the cumulative demand curve
- Schedule back an order considering a reasonably safe lead time for the missing amount
- Repeat 3 to 4 for all remaining periods
- Report ideal order points (or dates) and amounts and plot the inventory trend using the time-based balance equation
Have you noticed again? Inventory is the consequence of decisions around reception and demand… The algorithm manages order points to make sure the underlying inventory level is always positive. If you apply this algorithm, you will end up with something like this:
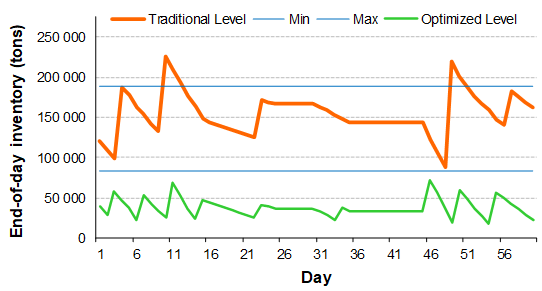
Figure 2a: Inventory level trends
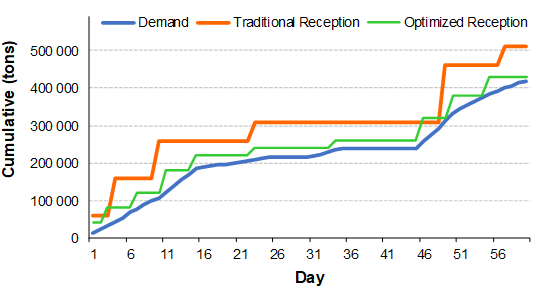
Figure 2b: Cumulative inventory with reorder points
Orange curve on Figure 2a shows the typical min-max limits. If the usual approach to managing inventory was used, we would order new products only when the forecasted demand would result in an inventory below the min. The inventory level would typically vary between the min and max levels (orange curve).
Green curves on Figures 2a and 2b illustrate the result of the optimal ordering algorithm presented earlier. The cumulative reception (green on Figure 2b) is strictly above the cumulative demand curve with a margin. This margin acts as a minimum level (or safety stock) that considers lead times variability and time-varying forecasted demand. This is as if the minimum inventory spec was adapting to time-varying demand instead of being constant. If this optimal approach was used, it would result in the inventory levels shown by the green curve in figure 2a which are much lower than the inventory level we would obtain from the "traditional" min-max approach (orange curve).
Some practical enhancements
The algorithm presented above is too simplistic for real-life applications. There are several enhancements we incorporated. My favorite one: Monte-Carlo simulation to estimate the risks of being out-of-stock or exceeding inventory capacity!
The idea is to induce variability in lead times according to their distribution and also in the demand forecast (forecast volumes are often revised over time…). The simulation generates “many” cumulative reception curves and aggregates the results such that 95% or 99% of the times, cumulative reception curve is above cumulative demand curve.
And then, it is possible to consider time windows: group orders too close in time because the shipper would batch them anyway. And why not: impose a safety delay to ensure all required material will arrive just before the beginning of production. And many other tweaks in the same fashion...
In conclusion
The concepts of safety stocks, reorder points and min-max inventory levels (safety stocks) are handy, simple to use, but... maybe not adapted to real-life. With modern programmable intelligent systems, it is possible to implement smart inventory management algorithms that can suggest ideal order points and amounts to minimize the inventory costs. This is just-in-time inventory for just-in-time production with no excess sleeping money in warehouses!
Want to learn more?
At Différence, our core expertise is centered on statistics and data science, Lean applications and operational excellence, and simulation! Don’t hesitate to ask for more information by contacting us.