
A real-life example: Meeting On Time In Full (OTIF) requirements
A manufacturing plant has a contractual obligation with its main customer to maintain an On Time In Full (OTIF) delivery rate of 90% per month for this year. This means that 90% of all orders must arrive on schedule and complete, without missing quantities or delays.
Over the past seven months, the plant’s OTIF has been lower than 90% on two instances; the latest being the last month. The plant’s customer service was able, through some tough discussions with the customer, to avoid the financial penalty a second time. However, the customer was clear that any other “bad” month would now result in significant financial penalties. Up until now, the team was working hard to be at 90% OTIF and they were reviewing their performance weekly; thinking this would allow them to adjust if the trend is bad in a month. Obviously, this strategy was not working. Recent results are shown in Table 1.
| Month | OTIF (%) | OTIF (no.) | Orders (no.) |
|---|---|---|---|
| Jan | 94% | 117 | 125 |
| Feb | 90% | 109 | 121 |
| Mar | 88% | 111 | 126 |
| Apr | 90% | 111 | 123 |
| May | 91% | 114 | 125 |
| Jun | 93% | 111 | 119 |
| Jul | 86% | 102 | 118 |

To face this challenge, the plant’s team reacted by creating a multidisciplinary team, led by a Lean Six Sigma Green Belt, to work on this problem using the DMAIC (Define-Measure-Analyze-Improve-Control) methodology.
Using the DMAIC problem-solving approach
It is now August 2nd and the team was given two months to implement improvements to the process. In the meantime, as a "band-aid" countermeasure, weekend shifts were started to increase the inventory and reduce the risk the orders won’t be "In Full". However, this solution could only be temporary because it was costly and the workforce was ready to do its share of the load by working on weekends … but not forever!
To define the problem, the Green Belt wanted to quantify the current condition and clearly establish the target condition. He used a P control chart to quantify the current situation since the data was not showing any sign of over or under dispersion (see Figure 1). From the chart he could establish that the actual average was very close to 90% and both normal monthly variation of the OTIF was between approximately 83% and 98%.
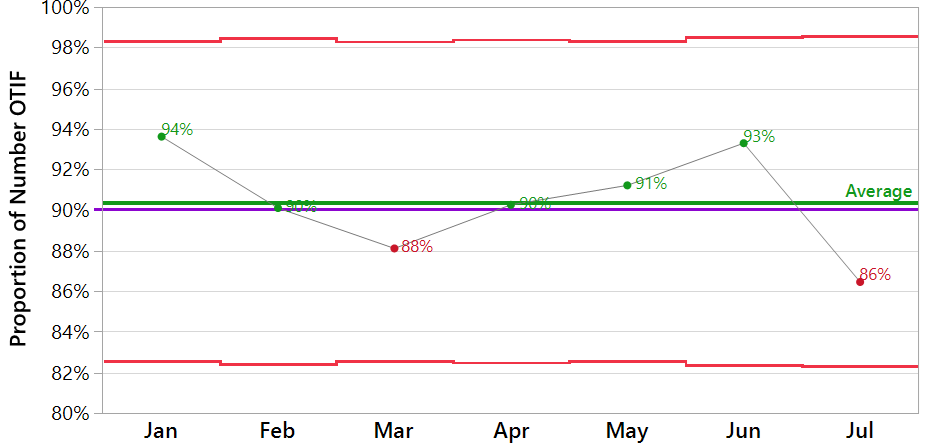
Figure 1 - P control chart on the monthly OTIF
From his Green Belt training, he remembered how to calculate the probability a Normal distribution would be below a value. However, here, the distribution was binomial and so he contacted his "Sensei" from Différence. Together, they evaluated that, with 122 trials and a true proportion of 0.904, there is about a 38.9% chance that the observed proportion falls below 0.9. When he revealed that risk to the management team, they were surprised but also really worried about their capability to meet the customer’s OTIF expectation.
The probabilistic risk-based target setting
Now that the current condition is quantified, the next question from management was: "What should be the process average if we want a low probability of observing a result lower than 90%?". The Green Belt answered this question by another question: "What is a low probability"? After some discussions, the team agree on one result below 90% in two years = 1/24 = 4%.
The Green Belt did his calculation and provided the following answer: If we keep a similar sample size of n=122, the OTIF process average should be approximately 94% (no assumption is necessary on the variation since it is a function of the proportion when the distribution is Binomial). This new information allowed the team to set a clear target condition: To be at an average of 94% OTIF in the next two months (an increase of 4%) (see Figure 2). With a clear target can then come a clear plan...
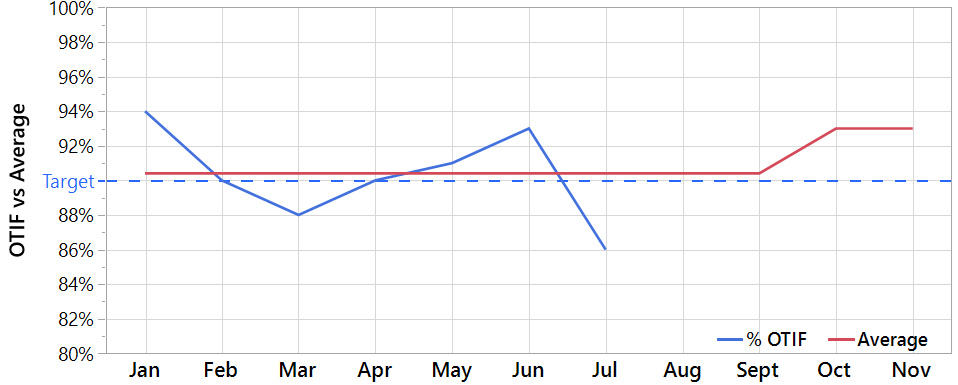
Figure 2 - Target condition for October and November
The conclusion and learnings
When there is a performance goal such as OTIF where the "target", here 90%, is in fact a minimum expected to be met every time the number is reported, many people cannot really tell what the risk is they won’t meet the expectation in the future. Because this risk is often not evaluated, it is common to underestimate it i.e. believing the odds of meeting the target are much better than they really are.
Using statistical thinking, it is easy for most situations to evaluate that risk. The consequence is often a clear call to action. People realize the risk is significant and they look for a way to improve the situation. The best way to attain outstanding performance is to be ahead of the game by:
- Having a realistic evaluation of our actual performance and capability to meet the goal
- Being able to clearly establish where the process mean and standard deviation must be so the risk of not meeting the goal is acceptable
- Developing a plan to reach the desired performance
On this 3rd point, let’s get back to our story... When the current and targeted conditions were shared with the management team, the head of customer service came up with another very interesting question: “How do we know the “band-aid” of increased inventory we are implementing for the next two months will actually reduce significantly the risk of our OTIF to be lower than 90%”? This is a very interesting question, and you will find out the answer in our next article.

Want to learn more?
At Différence, our core expertise is centered on statistics and data science, Lean applications and operational excellence, and simulation! Don’t hesitate to ask for more information by contacting us.