
Give a Boost to Your NPV and Financial Calculations with a Monte-Carlo Simulation
Written by Gerda Trollip on 2022-03-08
Financial calculations and the mining industry
Many industries, such as mining, utilize the Net present value (NPV) methodology to estimate the value of a project – and to determine whether implementing a project is financially profitable. The basic concept behind the NPV calculation, is to get the projected cash flow for the project over a period of time and calculate the present value of this cash flow based on the interest rate. The more positive the NPV, the better the project.
In most equipment upgrade and asset expansion cases, the cash flow series consist of an initial large expense (CAPEX), and then smaller returns (savings) over a longer period. Usually, the initial expense is due to spending capital at the start of the project, where infrastructure is built, or equipment is bought. The future smaller savings resulting from the initial expense, such as increased production or improved reliability.
The traditional approach for NPV calculation
Usually, these calculations are done on static assumptions: there is a fixed capital cost estimated, a constant increase in production etc. However, with this approach, variability, which is part of the real-life equation, is over-simplified or simply ignored. Variability can manifest in the fluctuations of the exchange rate, the interest rate, or the performance of the upgraded industrial process (used to calculate the increased throughput or savings). This is where simulation can add value by giving the ability to estimate a more realistic financial outcome of the project.
To illustrate this point, a typical NPV case study was developed. Imagine wanting to calculate the NPV of an ore crusher upgrade project of a mine with the following static assumptions, over a 10-year period. For the static (ordinary) estimate, there is a Capex flow of $1.6M at the start of the project, and for the next 10 years the production throughput is increased by 10 000 tonnes per annum and can be sold for $25 per tonne. A 5% interest rate is used in calculating the NPV. However, as mentioned earlier, assuming these input values will never vary is not realistic.
| Parameter | Unit | Assumption | Year |
|---|---|---|---|
| Capital expenditure (crusher installation) | Million $ | 1.6 | 0 |
| Increased throughput (additional tonnes) | t/annum | 10,000 | 1 to 10 |
| Selling price | $/t | 25 | 1 to 10 |
| Interest rate | % | 5 |
Calculating the NPV with the static assumptions gives an estimate of $314,700. This, however, does not give decision makers a lot of information about the uncertainty in the estimated NPV. Sometimes, analysts go a step further and calculate the minimum and maximum NPV estimate by setting the assumptions simultaneously at their worst and best values. In the abovementioned case study, this translates to -$604,600 and $1,752,400. This does show stakeholders that there is a possibility that the project could not be profitable, however it is still difficult to understand the probability of achieving a certain NPV given these extreme values.
Using Monte-Carlo simulation for financial calculations
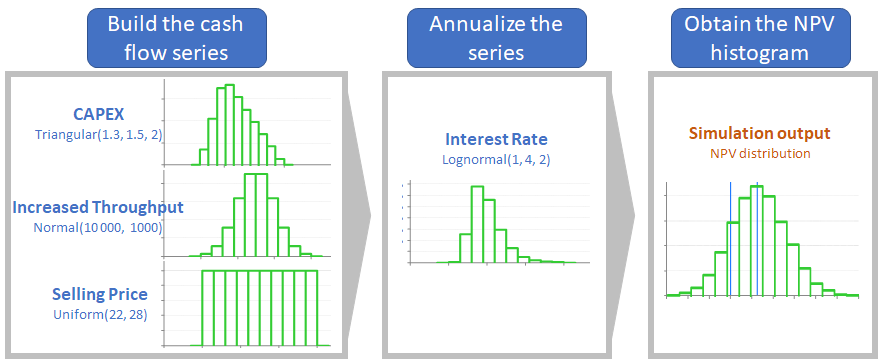
Monte Carlo simulation samples from the random distributions of the variables (in this example: Capex, Increased throughput, Selling price and Interest rate) and calculates the NPV repeatedly. This process is done many times, and the NPV is stored and collected for statistical post-processing analysis. Therefore, we obtain not 1 or 3 NPV scenarios, but at least 10,000! And these scenarios cover a wide range of input values combinations, not just all-at-worst and all-at-best! The figure below illustrates the process of doing a Monte-Carlo simulation.
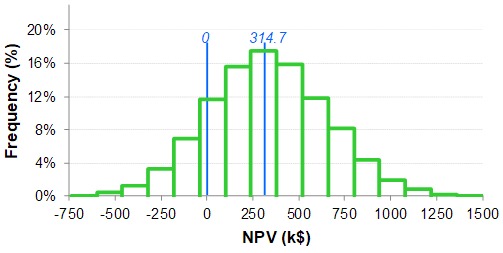
On this histogram, there are 14.5% of the values that are negative. This is the probability that the project will not be profitable. This figure allows decision makers to understand the possible risk and return, and make their decision based on the knowledge of their operation and their specific risk tolerance.
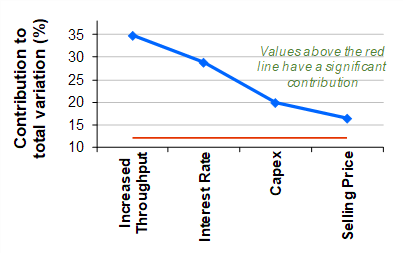
Utilizing the Monte Carlo output during post-processing analysis, also gives analysts the opportunity to get additional insights such as the importance of each variable on the NPV obtained. In this case study, the most important variable is increased throughput; followed by interest rate; then capex and selling price. This gives the decision-makers the ability to focus their attention on the levers that will ultimately have the largest impact on making a project successful.
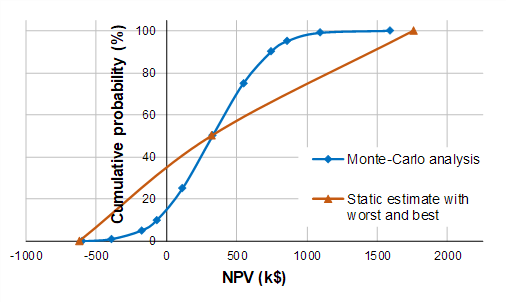
Using simulation to sample values from a distribution instead of constant assumptions allows capturing the distribution of possible NPVs. With that information in hand, decision makers have more power to evaluate the chances of being profitable or not. They can also evaluate their chances to be above or below a specific threshold. An additional post-processing of the results can also put in perspective the variables having the most influence, or sensitivity, on the NPV.
Going further with simulation: Discrete Event Simulation
One could go even further! The "increased throughput" variable could be estimated realistically by creating a Discrete Event Simulation (DES) of the improved process that captures the dynamic effects of system interactions, queuing, operating logic, process variations, random failures, competition for resources, logistical and process constraints and other phenomena observed in real systems and quantifies the cumulative capacity losses associated with them. To learn more about DES, the reader can refer to this page or to this training program.
Want to learn more?
At Différence, our core expertise is centered on statistics and data science, Lean applications and operational excellence, and... simulation! We can train, coach and help practitioners to learn how to use Monte-Carlo simulation and Discrete Event Simulation. Don’t hesitate to ask for more information by contacting us.