Control vs Tolerance Limits: Do You Know the Difference?
Written by Vincent Béchard and Martin Carignan on 2025-10-16
Please read me! I am not (that much) statistical!
Why using limits in statistics?

Let’s begin with a bit of philosophy around the different limits’ definitions in statistics. Probably the most popular is the confidence interval on the mean (range of values in which the true population mean should reside with a given confidence level). Then, we have specification limits (lower and upper bound defining what is acceptable from the customer’s standpoint). But we also do have control chart limits (expected variability from the process historical data). Oh no, we are now adding a fourth type: the tolerance limits (inferred variability of the population given a sample from it).
Why so many different types of limits? Because the limits should be adapted to the purpose of the data-driven decisional process:
- Confidence interval on the mean: to decide if the sample gives sufficient precision on the estimated population mean or to test the hypothesis "Is the population mean different from a target?"; calculated using sample data, the width shrinks as the sample size increases.
- Specification limits: given or imposed by the customer to distinguish a good from a bad product; you can challenge them or challenge the methodology to establish them, but they will remain stated values.
- Control chart limits: to decide if the process is stationary and in-control; calculated using historical data. Their calculation is not affected by the sample size although more data increases the calculation accuracy.
- Tolerance limits: let’s define those in the next section.
Some people, to obtain the potential range of expected individual values from their process, use the control limits of an I-MR control chart. However, this is perhaps not the best approach. Hence, it looks like we need to understand better the difference between control limits and tolerance limits!
NOTE: the confidence interval on the mean is the only type, among the types mentioned hereabove, that does not deal with the distribution width of individual values, it focuses uniquely on "where is the population’s average?"
Control and tolerance limits explained
Both limit types aim at determining a range that captures the intrinsic data variability. They are both based on a notion of “sigma”, a measure of variability:
Control limits
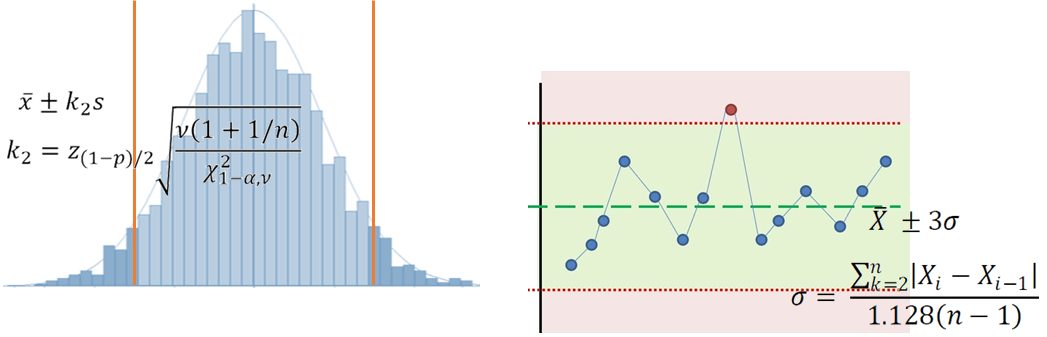
Sigma (σ) represents the natural process variation. For individual values, σ is obtained using the time series point-to-point average variation (called the moving range). Important: the data must be organized in chronological order! The limits are obtained by taking the average ±3σ. The constant (3) is not affected by the sample size used to calculate the limits. It is similar to assuming that σ (calculated from the data) is in fact the population’s σ!See the statistical details here.

Tolerance limits
Sigma (σ) represents the variation in the population studied. It is estimated using the standard deviation of the sample data. The limits represent the range that should cover at least a stated percentage of the population with a stated confidence level. This is an inference from the sample data to the underlying (unknown) population. It assumes the data is normally distributed.See the statistical details here.
Where do we usually see those limits? Control limits appear on control charts, while tolerance limits appear on histograms! Control limits are used to detect changes in a process over time while tolerance limits are used to define the range covering a percentage of the population (assuming the sampled data is representative of the population).
Illustration of the tolerance limits concept
A new product is being made on a machine. The process engineer would like to assess the probability a quality specification will be met (the width of this quality specification is 60). Ideally, the process should produce at least 99.73% of good products. Since he must rapidly get an answer, he designs an experiment where he varies all the major factors that could contribute to the variability in the product quality. He collected 25 observations that should represent the normal variation expected in this product for future runs. The standard deviation of those 25 observations is 10.
Situation #1: He uses control limits (±3σ) to assess the expected future variation of this product (assuming those limits should cover 99.73% of the population if it were Normally distributed). He obtains the following limits width: ±3*10 = 60. He concludes that he should have 99.73% of the future products meeting the specification limits. It is a success!!! Really?
Situation #2: He uses a tolerance interval calculation to assess the expected future variation of this product. The calculated interval should contain at least 99.73% of the population results with 95% confidence level. He obtains the following limits width: ±4.04*10 = 80.8. He realizes that, with the actual sample size, we cannot conclude we have the expected capability to meet the specification limits. There are two possibilities from here:
- Collect a total of approximately 400 observations and hope the observed standard deviation will be lower or equal to 10. Indeed, with 400 observations, the value of the constant drops to 3.19.
- Truly work on the root causes: eliminate sources of variability and re-assess the new standard deviation
The danger of systematically using ±3σ limits to estimate tolerance limits
Let’s compare the probability of covering at least 99.73% of the data with an interval that is obtained by using ±3σ. For a sample size of 25 observations, this probability is only 59% !!!

The 99.73% coverage assumption behind ±3σ limits holds only... when the sample size is very large! With less than 50 data values, the probability that the control limits really cover 99.73% of the population is lower than 70%. If the question is: "What is the expected data range?" and a limited number of observations is available, then tolerance limits are more useful than control chart limits!
In conclusion
In statistics, both control and tolerance limits are important. Nevertheless, it is crucial to know what they are meant for and what are the assumptions behind them. Both limit types assume normally distributed data. However, the control chart limits rely on time-ordered observation and assumes the short-term sigma is representative of the "normal" process variation. The goal of those limits is to monitor a process to identify assignable causes of variation.
Conversely, the tolerance limits deals with sample data and let the analyst control the distribution coverage and confidence level. They are used to identify the range of values that will cover a determined percentage of the population at a fixed confidence level. Since they consider the uncertainty associated to the sample size, they are very useful when a limited amount of data is available.
Want to learn more?
All the analyzes presented in this article were executed using our Excel addin for statistical analysis; visit this page to explore its features. At Différence, our core expertise is centered on statistics and data science, Lean applications and operational excellence, and simulation! Don’t hesitate to ask for more information by contacting us.