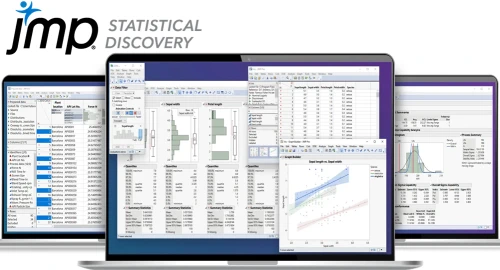
Training on statistical data analysis using the JMP software
Whether it's to improve processes, increase performance, or boost profits, it's a good idea to exploit (statistically!) the information hidden in historical data. How to do it? Using modern software for data exploration and analysis is an excellent starting point! This allows to quickly leverage the information contained in the data without having to program complex statistical formulas yourself. And what about the usefulness of graphs to understand the meaning of the data!
You have a Yellow Belt or Green Belt Lean Six Sigma certification? This training covers most of the statistical topics using JMP! You are considering a Black Belt certification? This training is a great introduction to JMP and will help you take your skills to the next level!
This course is designed with the mindset that when production data is available, we quickly need to get to statistically valid conclusions. To achieve this, this course covers the steps of importing, preparing, organizing, visualizing, and analyzing data. An excellent support this process is the JMP software, regardless of the volume of data to be handled.
Training objectives
- Learn how to use the JMP software
- Import, cleanse, and organize a data table
- Create simple charts to visualize data
- Perform several statistical analyses
- Be able to analyze historical production data
Target audience
- Anyone who must make decisions using data
- Process engineer, data analyst, professional, technician and manager aiming to exploit historical data
Format
- In-person sessions
- 30% theory and 70% practical (bring your dataset for exercises)
- Duration, level 1: 8 hours (day 1)
- Duration, level 2: 16 hours (days 1 et 2)
Content
Day 1:- The JMP interface, operations on rows and columns
- Importing data and organizing tables
- Data exploration: histograms, normality plots, trend charts
- The ImR control chart
- Comparing one, two or several groups (ANOVA)
- Power and sample size
- Comparing paired data
- Pareto analysis
- Scatter plots, linear correlation and simple regression
Requirements
- Install the JMP software
- Understand basic statistical concepts such as the calculation of an average and a standard deviation
This training is practical, theoretical elements are very limited. For more information or to book your training, please contact us!

